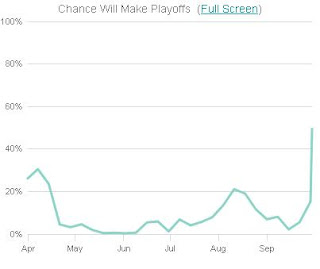
Let's start with the White Sox:

Hey rollercoaster! Surprisingly, for almost a month, they were over 50% to make the playoffs. But now, look at that fall. It kind of represents the White Sox as a whole, come to think of it: play real good for a month during the season and justify all their mouth-breathing fans, only to tank it when it counts. Saaaaaaaaaad horns.
Now let's take a look at the Twins:

Wow, they bottomed out in June and July. But that was when Morneau hurt his head, and then all of a sudden they started winning. Now they are streaking towards 100%. Typical Twins season, play around in the middle of the year, and then CLOSE HARD.
And, just for comedy, the Tigers:

That's what the machine looks like when they lose the patient.
-------------------------------------------------------------
EDIT: I'm taking this up a notch.
First, look at the Nationals from 2007. I don't think you could come up with a better description for this, other than, WEEEOMP

Next we have the Rockies from the same season. What a run to get back into it (and eventually go to the Series). They were pretty much a flat-line, and then it was off to the races...

And, finally, the Mets from 2007. Oh heavenly father, what an epic collapse

4 comments:
I've seen those graphs at my work. More Mets than anything sadly.
I love it when you turn to graphs!
Also, how many mouth breathers out there really believe their team is going to capitalize on their 10% chance? -4? Manny?
Well, check that. Manny is more of a face breather - in that he uses his whole face for air exchange.
Post a Comment